Market Concentration in US Online Learning
An update and a longitudinal view

Was this forwarded to you by a friend? Sign up, and get your own copy of the news that matters sent to your inbox every week. Sign up for the On EdTech newsletter. Interested in additional analysis? Try with our 30-day free trial and Upgrade to the On EdTech+ newsletter.
In late 2023, we published a post examining market concentration in US online learning. My interest had been sparked by a 2019 McKinsey post showing that the top 10 higher education institutions in online learning (exclusive DE enrollments) held 20% of the market.
Phil then analyzed data from the following year, one year after McKinsey's snapshot, and found that market concentration had dipped slightly, with the top 10 institutions accounting for 19.3% of the market.
We recently revisited the most current data (and by we, I mean Phil) and discovered that concentration has risen again. Additionally, when we break the data into graduate and undergraduate segments, we see a much higher level of concentration in the graduate space.
By looking at the data across time we got a deeper and more nuanced view of how market concentration in online learning is changing and what drivers might be behind those changes. Market concentration reflects broader market dynamics and are deeply affected by the rise and decline of the larger providers in each sector of the market.
Market concentration in Fall 2023
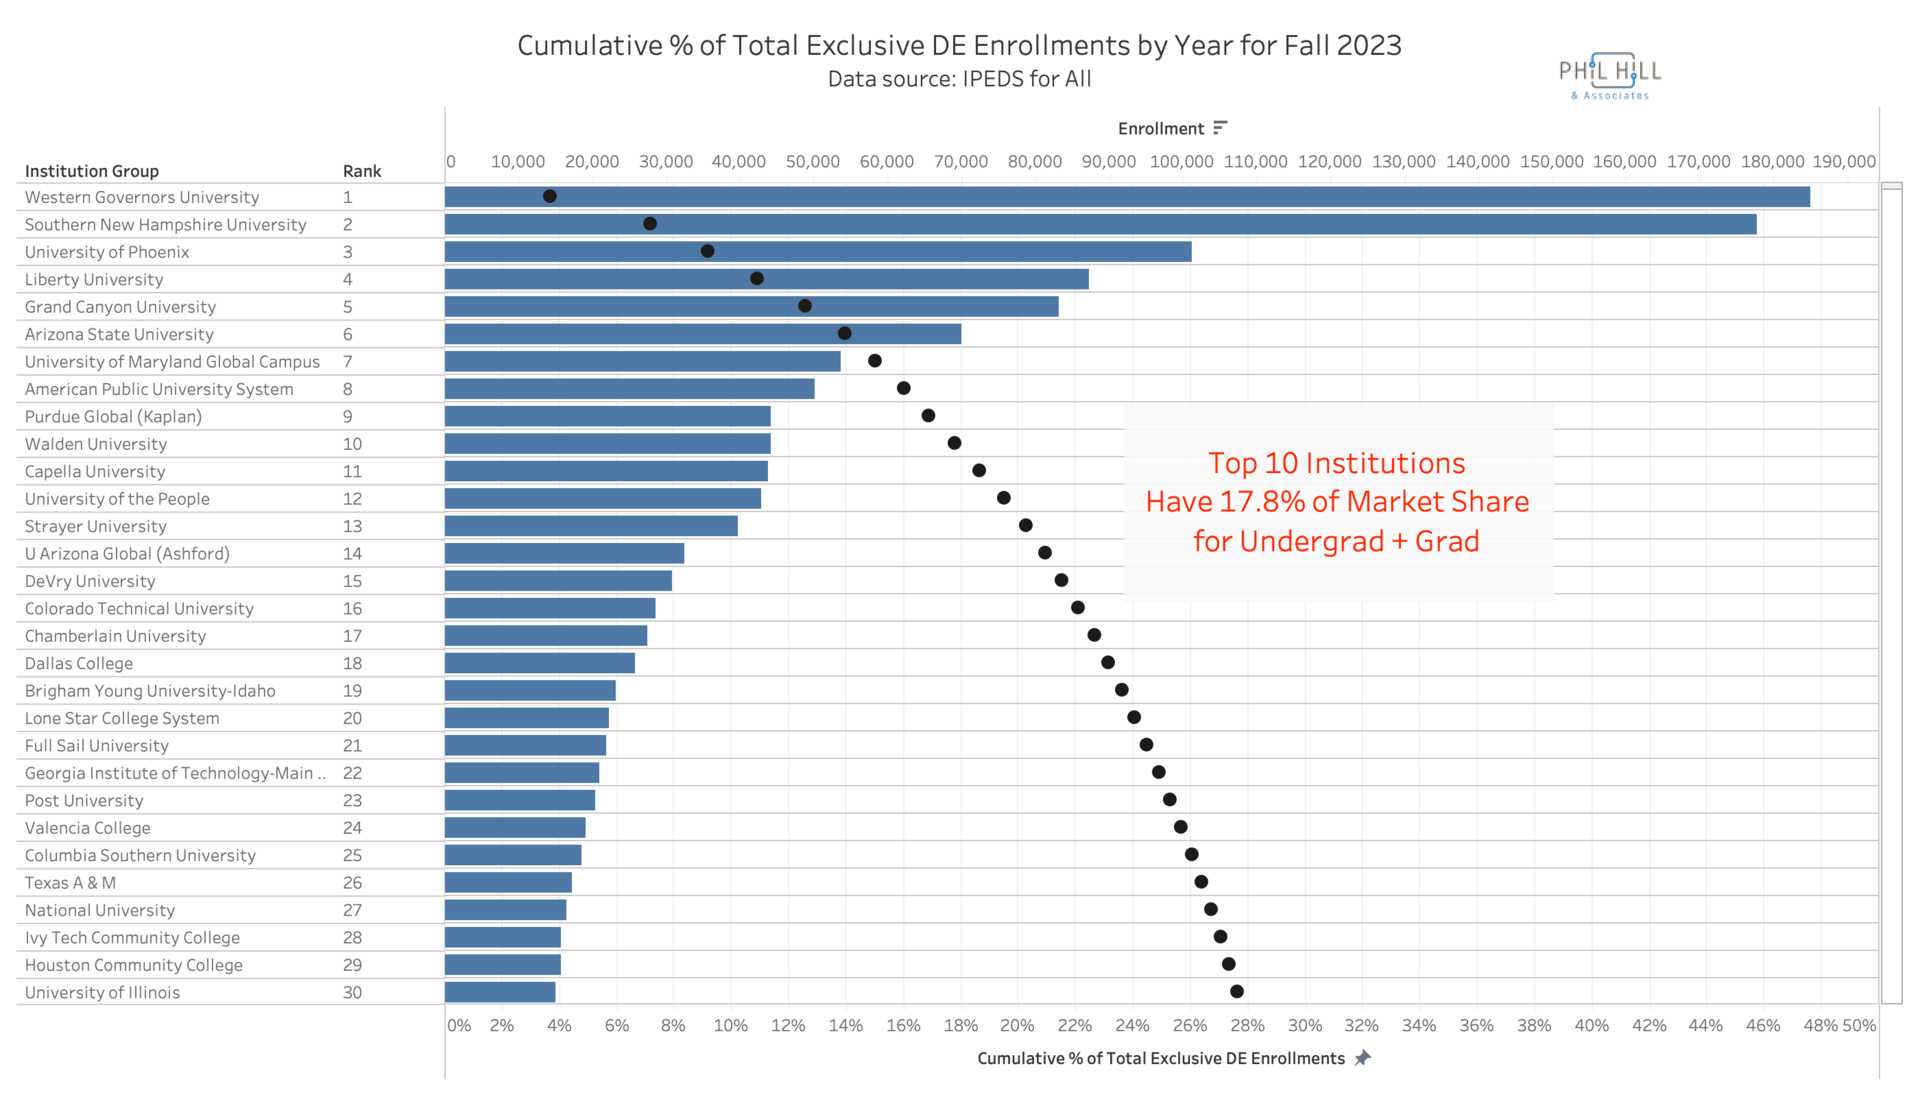
Looking at the data for exclusively online enrollments in Fall 2023 for undergrad and grad degrees combined, can see more of the patterns involved. This chart shows exclusive distance ed (DE), or fully online programs, for each of the largest-enrollment institutions, and a separate trend line (shown in black circles) representing the running total of market share. WGU exclusive DE enrollments represent 3.7% of all exclusive DE enrollments, SNHU adds 3.5% (total of 7.2%), U of Phoenix adds 2.0% (total of 9.2%), etc, etc. The top 10 institutions have 17.8% of market share.
Different patterns based on degree type
Things get more interesting when we break down the data by undergraduate and graduate enrollments. The undergraduate market closely mirrors the overall trend, with the top 10 institutions accounting for 17.7% of total enrollment.
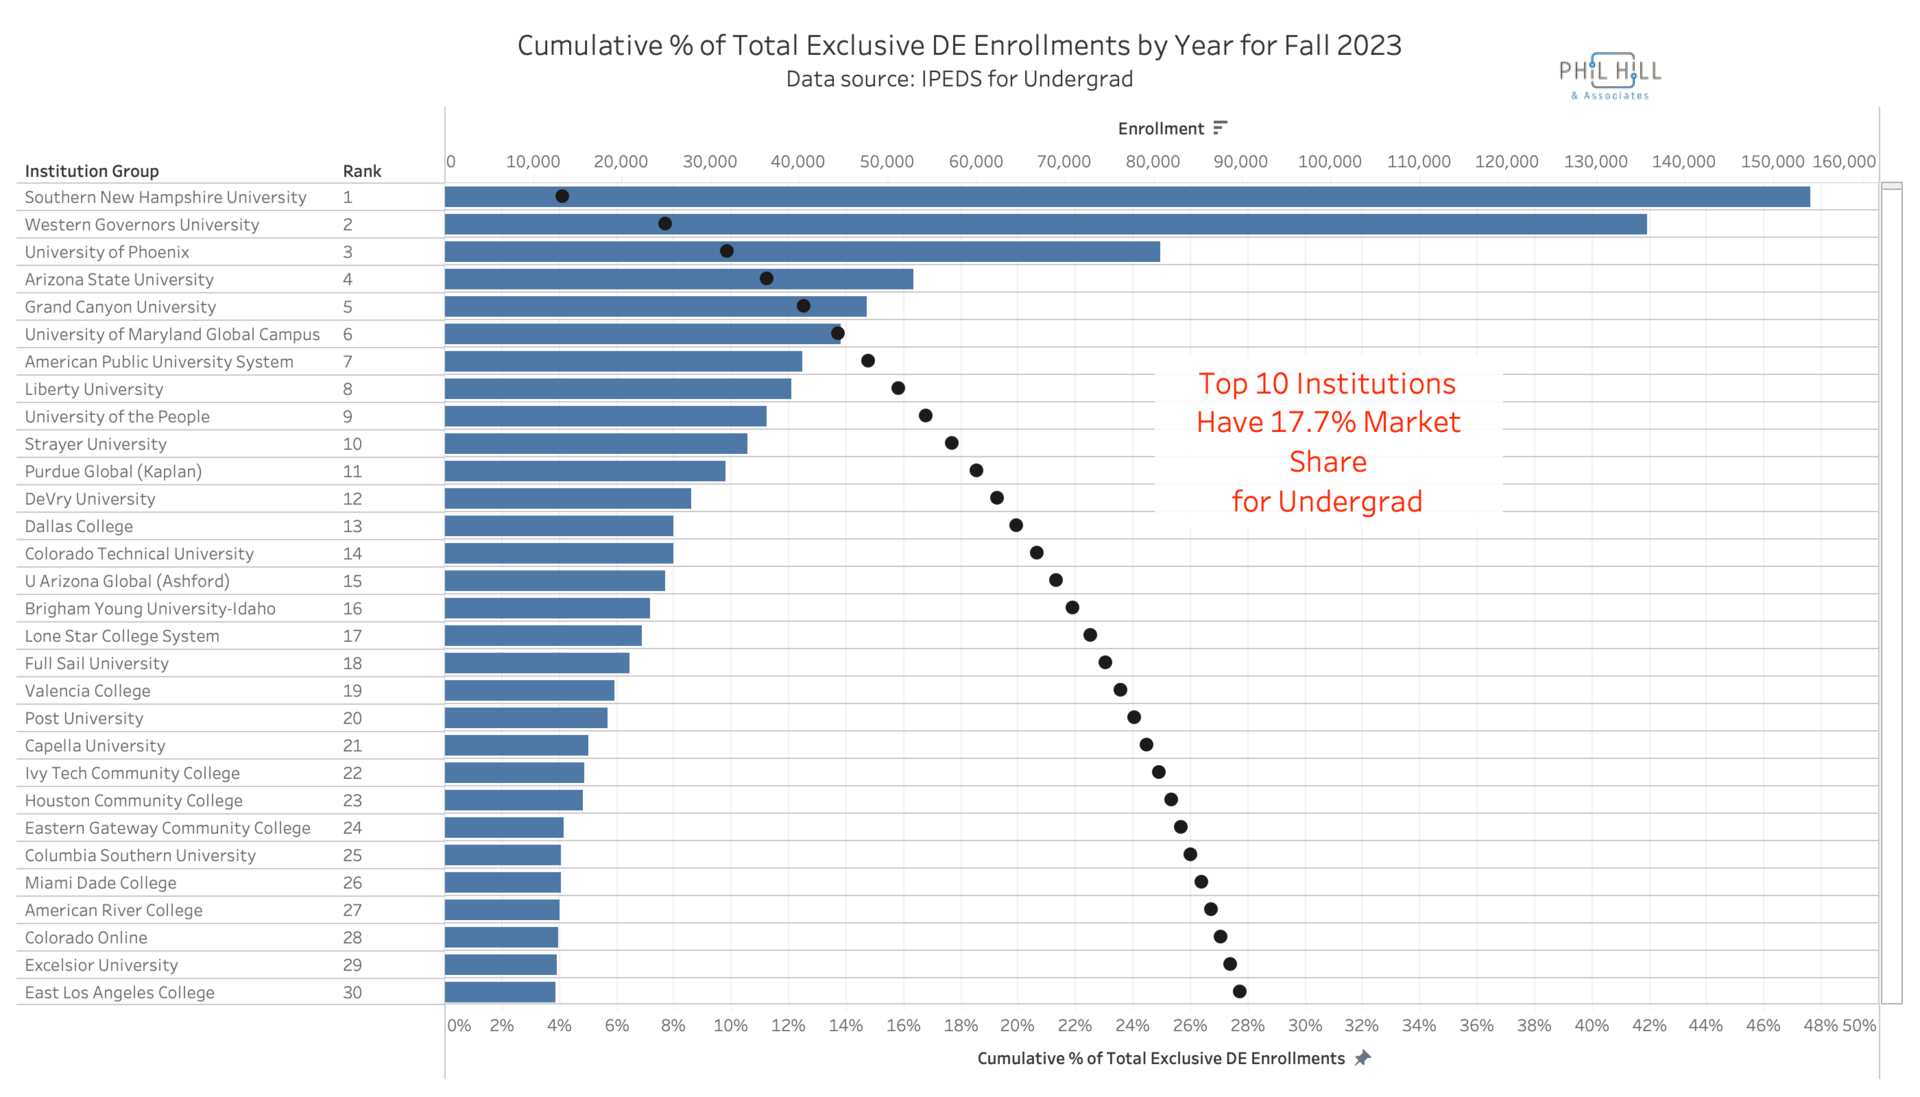
The institutions themselves are fairly consistent, at least within the top twenty. Further down the list, however, we see a greater presence of community colleges compared to the combined list. For example, Miami Dade College and East Los Angeles College appear, unsurprising, given the growing role of community colleges in the online space.
In contrast, the graduate market presents a very different picture. Here, the top 10 institutions account for 23.0% of total market share.
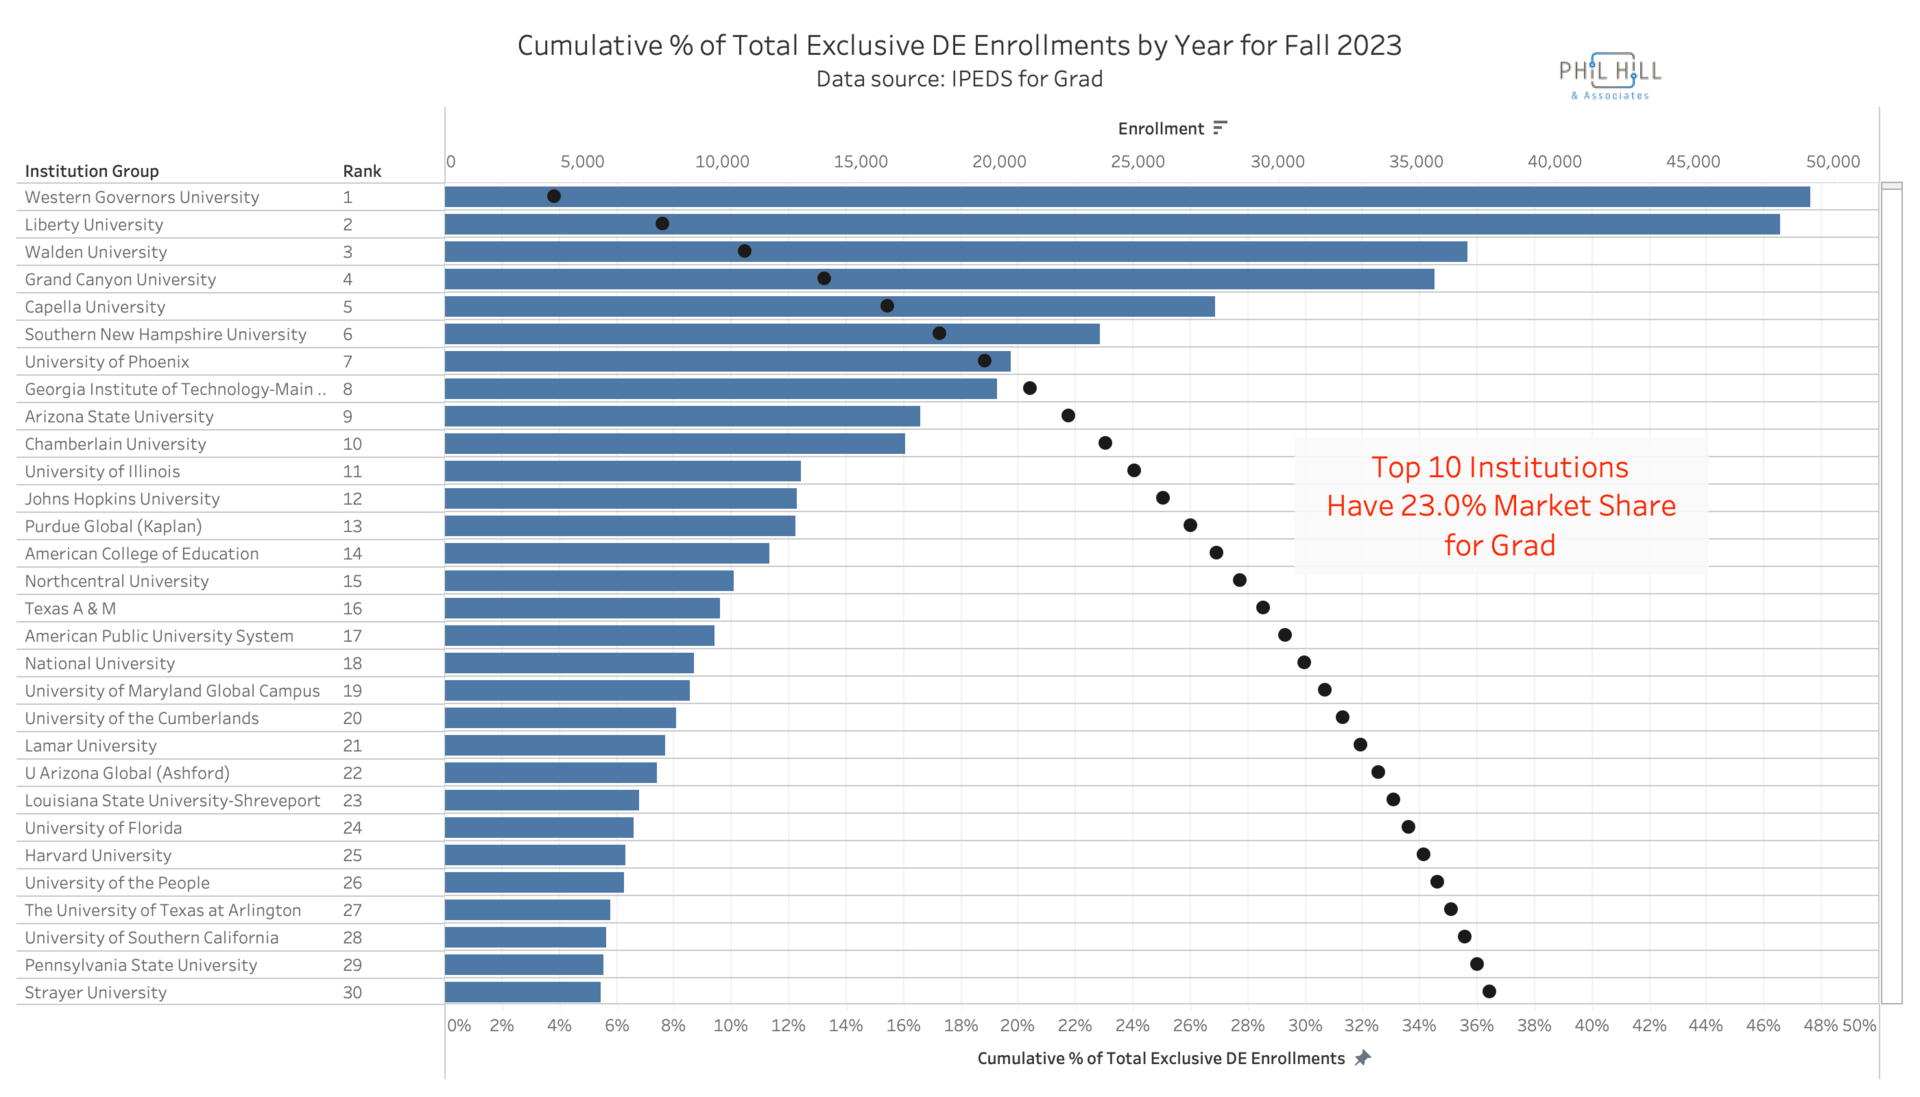
We also see some notable shifts in the institutions represented, with the entry of both well-known and lesser-known names. Georgia Tech appears at number 8, and the University of the Cumberlands joins the list at number 20. But why is the graduate online market so much more concentrated?
The graduate market is dominated by a handful of large institutions with extensive graduate portfolios, Western Governors, Liberty, Walden, and Grand Canyon, for example. Individual graduate programs tend to be small, so institutions with broad program offerings tend to dominate the landscape. Even schools with high-enrollment programs, such as Georgia Tech (with its OMSCS) and Illinois (with the iMBA), have less impact on overall market concentration because their graduate portfolios are narrower.
The trends in market concentration over time
Given the number of institutions seeking to enter or expand their online footprint, for example, the University of Tennessee, which we recently highlighted, I expected to see a trend toward a less concentrated market. I wondered whether increased fragmentation in the long tail of the market might explain why new entrants weren’t reducing market concentration as much as we might expect. These new entrants may be competing primarily with one another and with smaller, less established players, while the larger, more established institutions continue to grow.
But then Phil the visualized the data longitudinally, from 2012, when data on exclusively DE enrollments first became available, through Fall 2023. What we see is a steady decline in market concentration up until the pandemic, followed by a sharp drop as most institutions moved online. However, as many institutions returned to primarily on-campus instruction, market concentration began to rise again, and has increased every year since Fall 2020.
That said, the pace of this increase has slowed since 2021, and no sector of the market has returned to the level of concentration seen in Fall 2019, just before the pandemic. While the grad markets continued a decline in concentration into the pandemic, there was already a rise in concentration (or at least a flattening out) for undergrad degrees and combined degrees from 2017 - 2019.
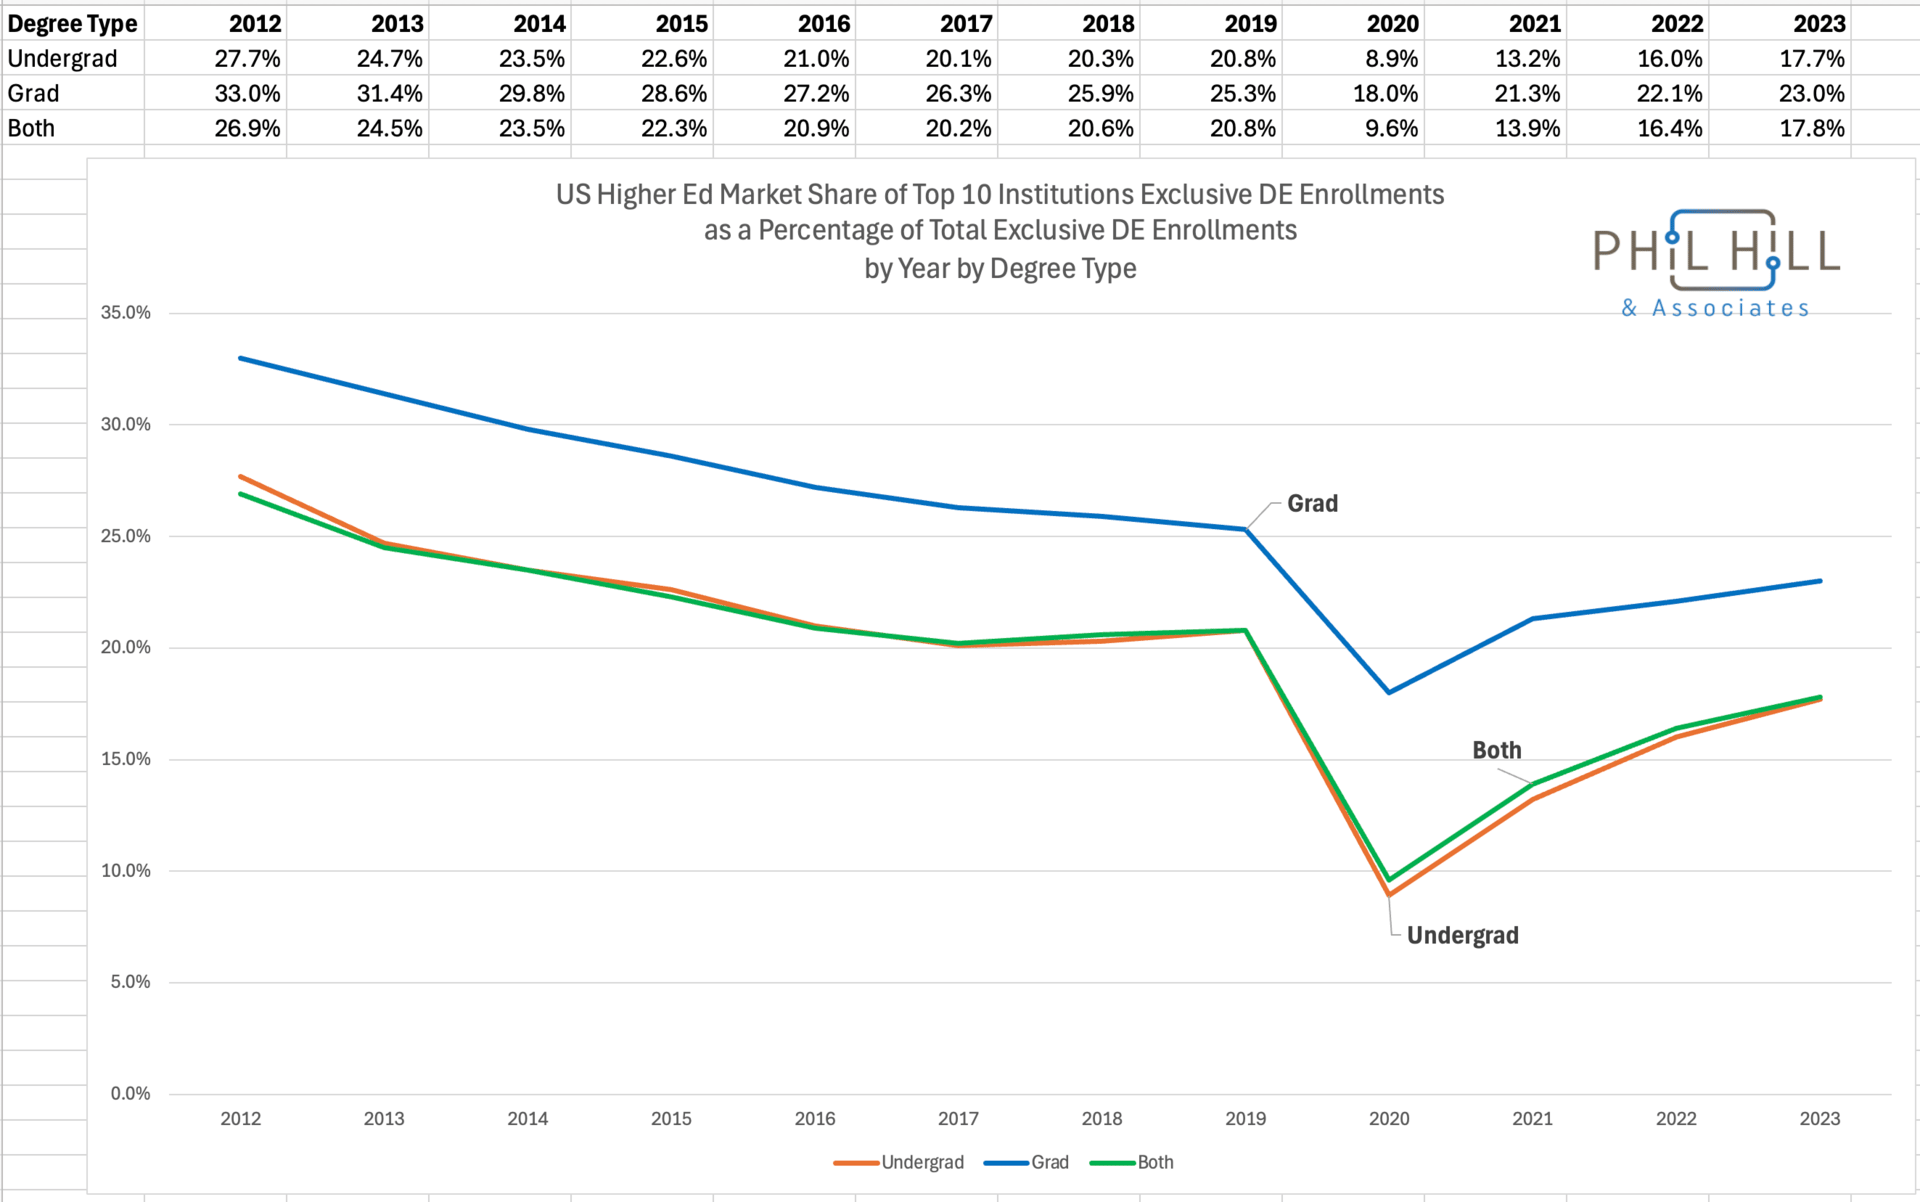
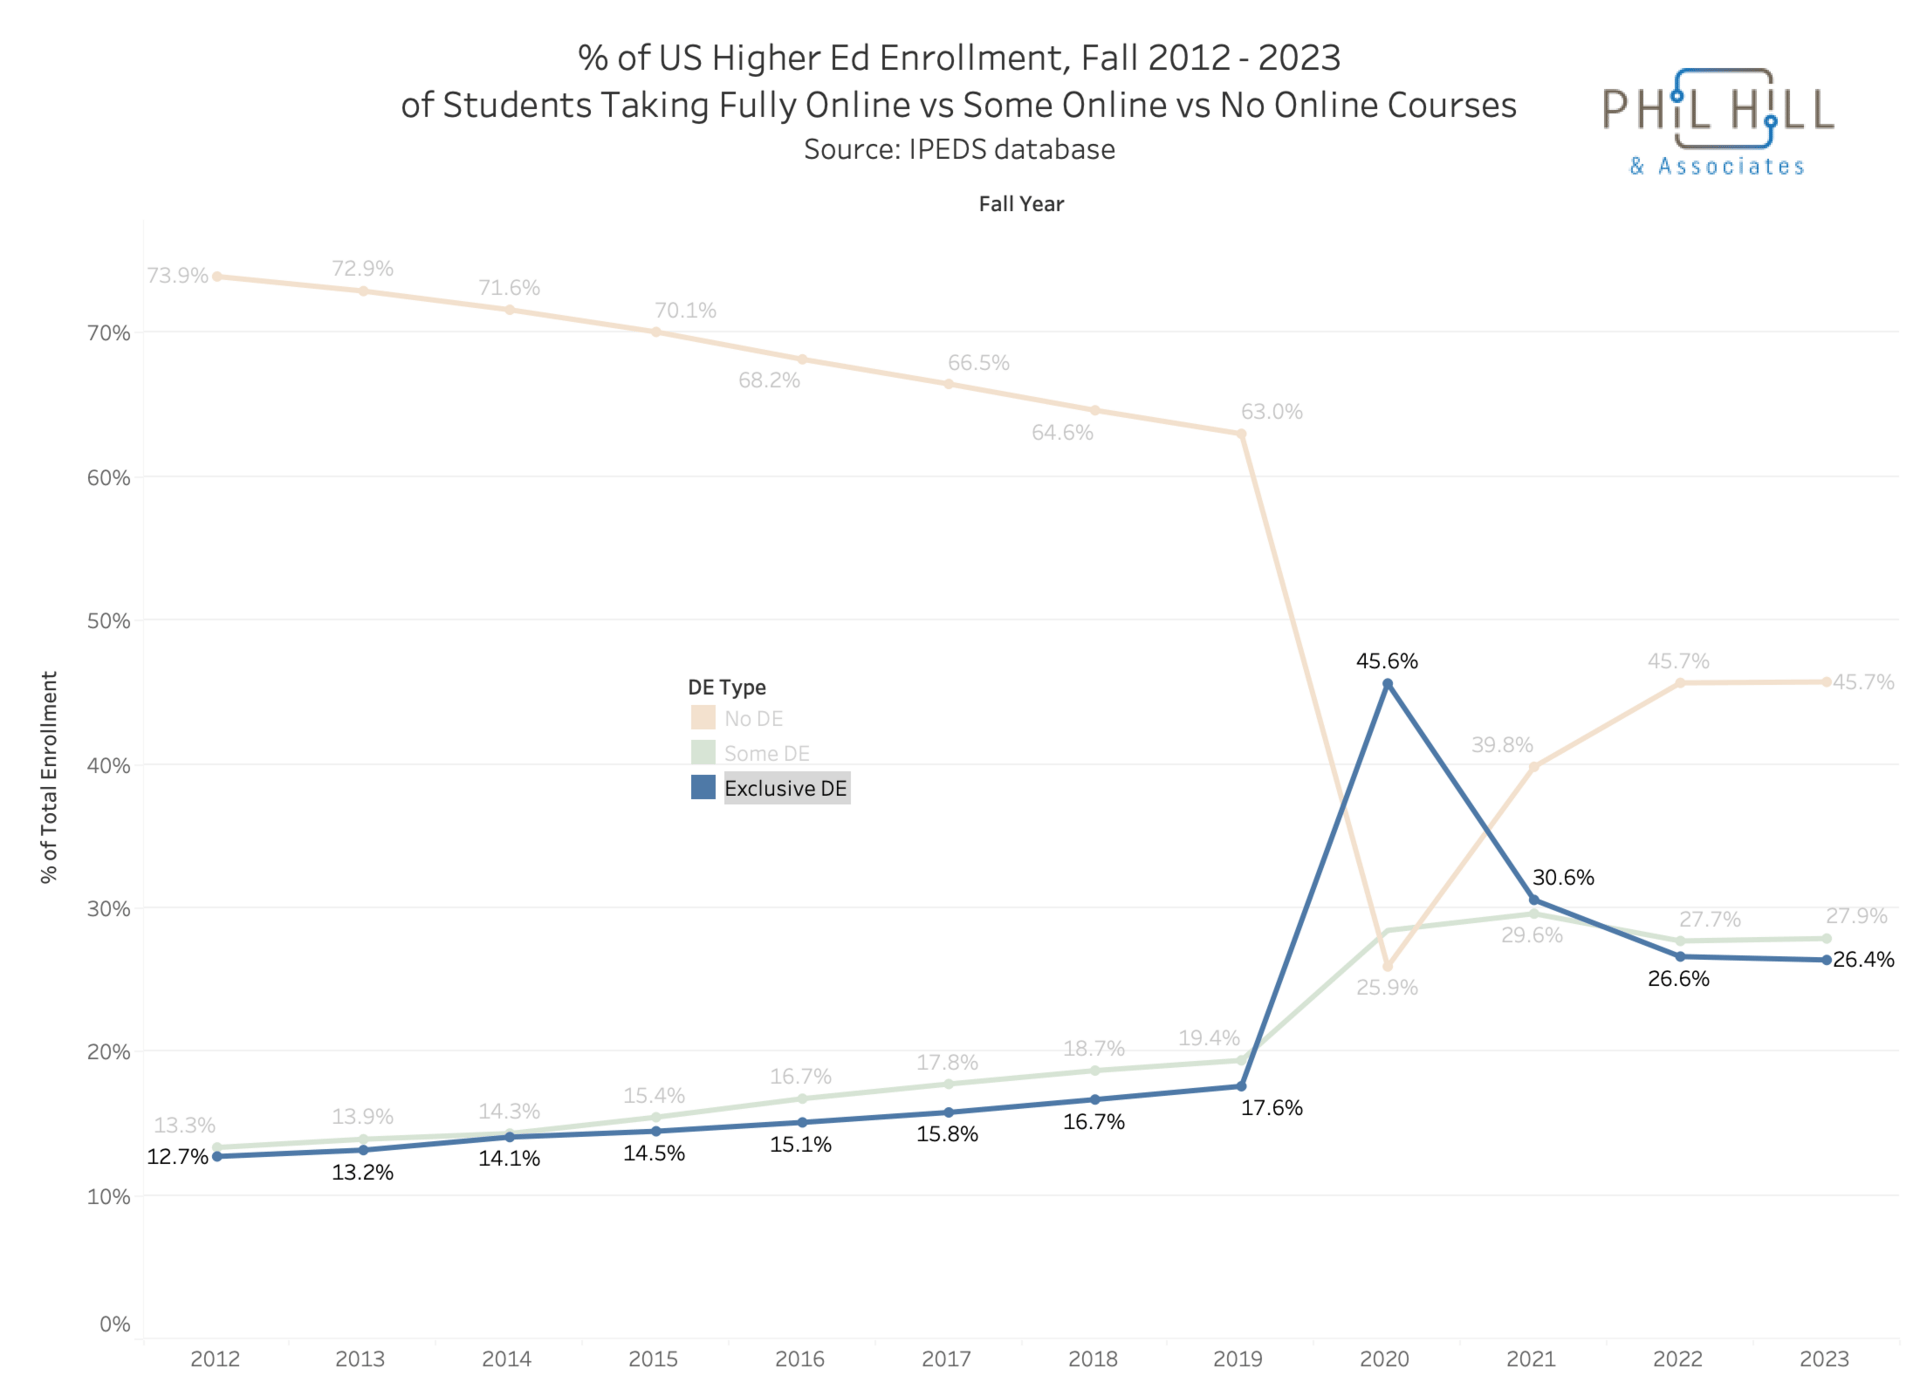
Market concentration reflects broader trends in the online learning market, shown below with exclusive DE enrollments shares highlighted (combining undergrad and grad degrees). As online education has expanded, market concentration has generally decreased. The COVID-19 pandemic represents a notable outlier—during its peak, the rapid shift to online learning led to a far less concentrated market, as nearly all institutions moved online.
As the pandemic receded, online enrollment declined but appears to be stabilizing at a higher level than before, signaling a lasting shift in the acceptance and adoption of online learning. In parallel, market concentration has begun to rise again, though not to pre-pandemic levels.
Additional drivers of market concentration change
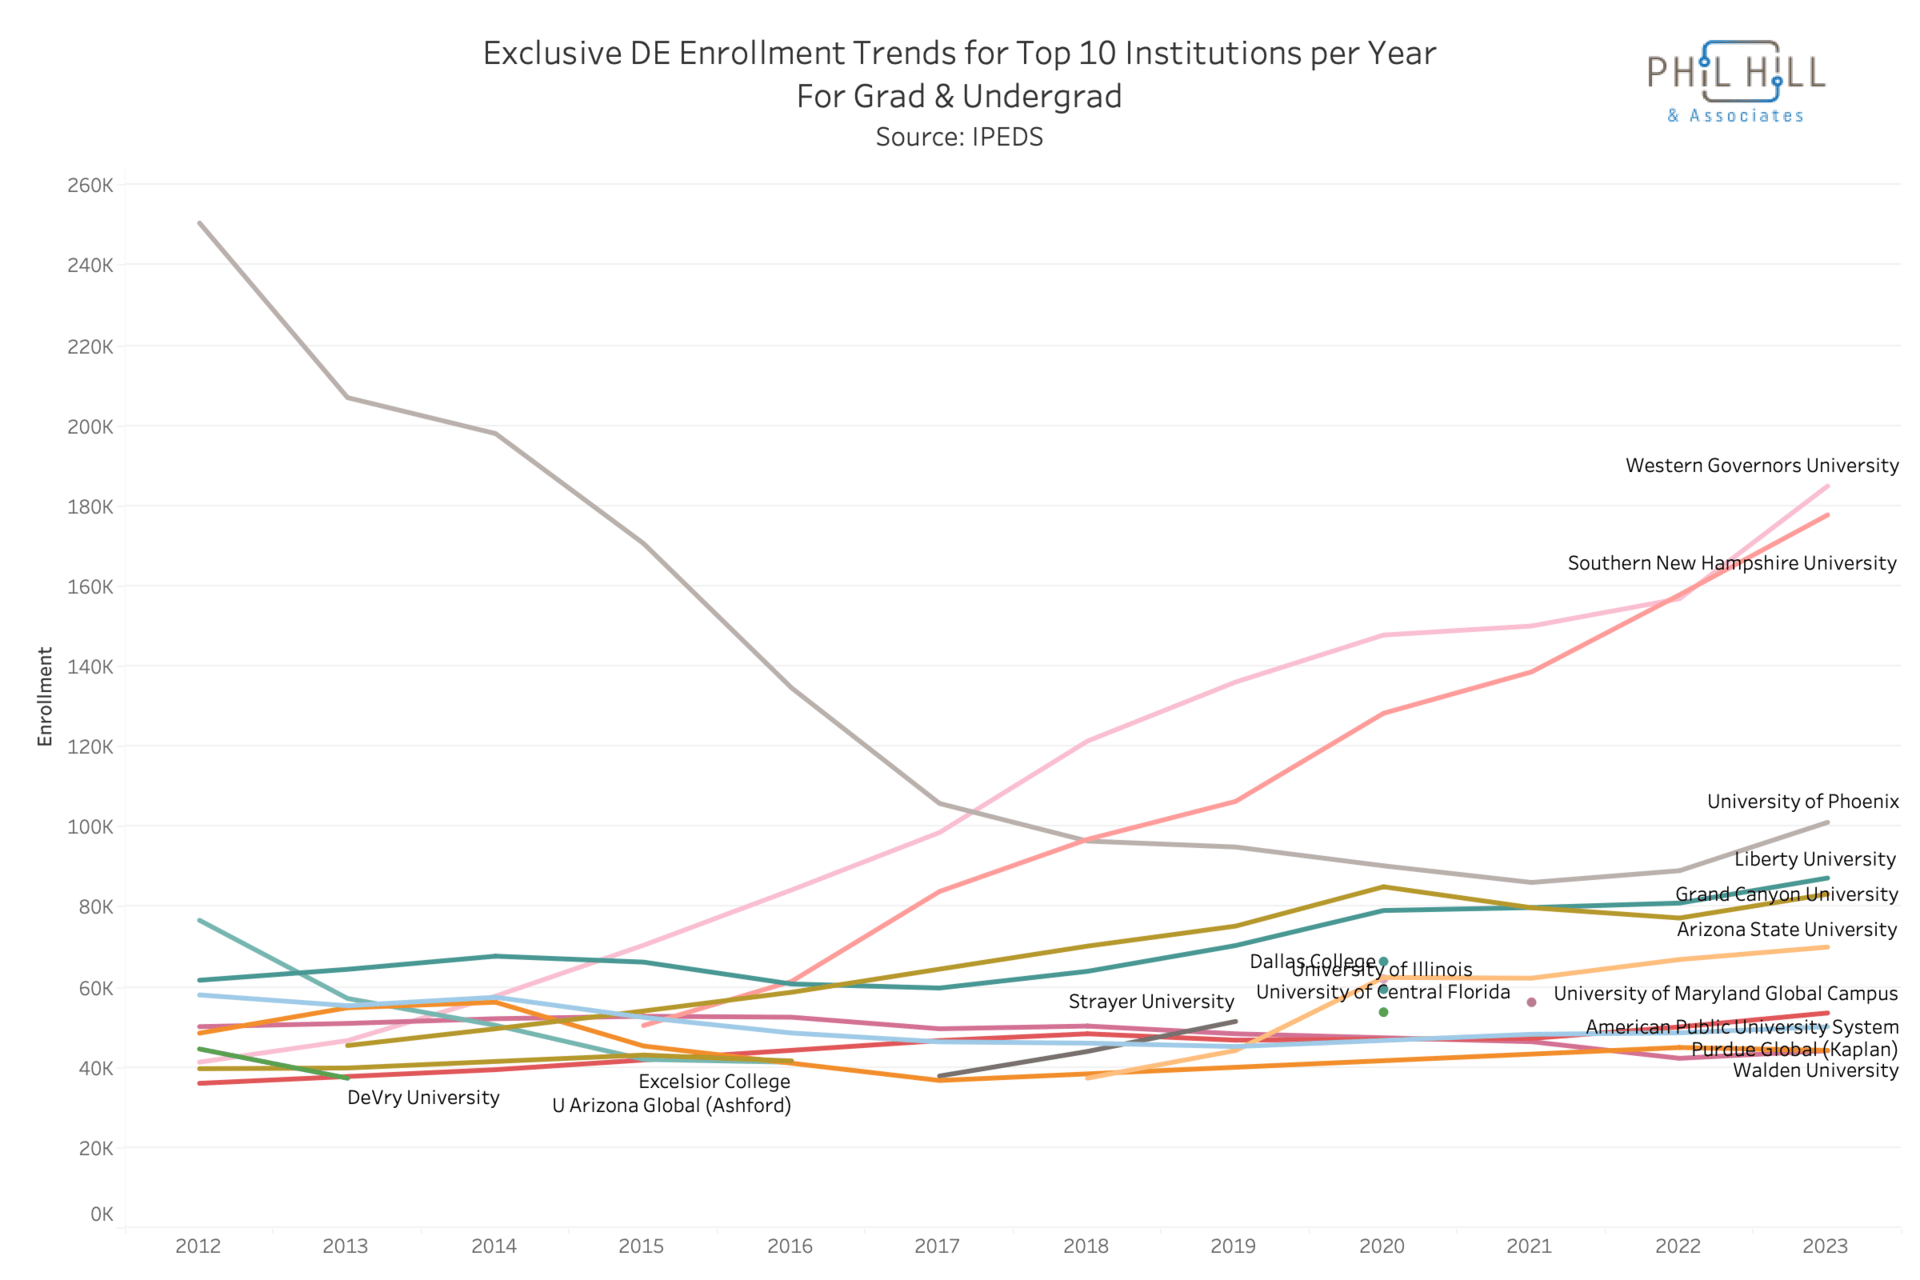
But market concentration in online learning isn't solely a reflection of the total number of students enrolled. The dynamics of individual institutions that are heavily engaged in online education also play a significant role in shaping market concentration. To explore this, we examined enrollment trends over time for the top 10 institutions in each sector, undergraduate, graduate, and combined.
From 2012 through 2017, the primary driver of the reduction in market concentration was simply the decline of the University of Phoenix enrollments. That’s what happens when a single institution has a quarter million online enrollments. In the chart, gaps in the lines for certain institutions indicate that they were not among the top 10 in a given year.
From 2017 through 2023 in broad terms, you can see that much of the rise in concentration comes from the growth of WGU, SNHU, Grand Canyon University, and Arizona State University, as well as a recent revival at the University of Phoenix.
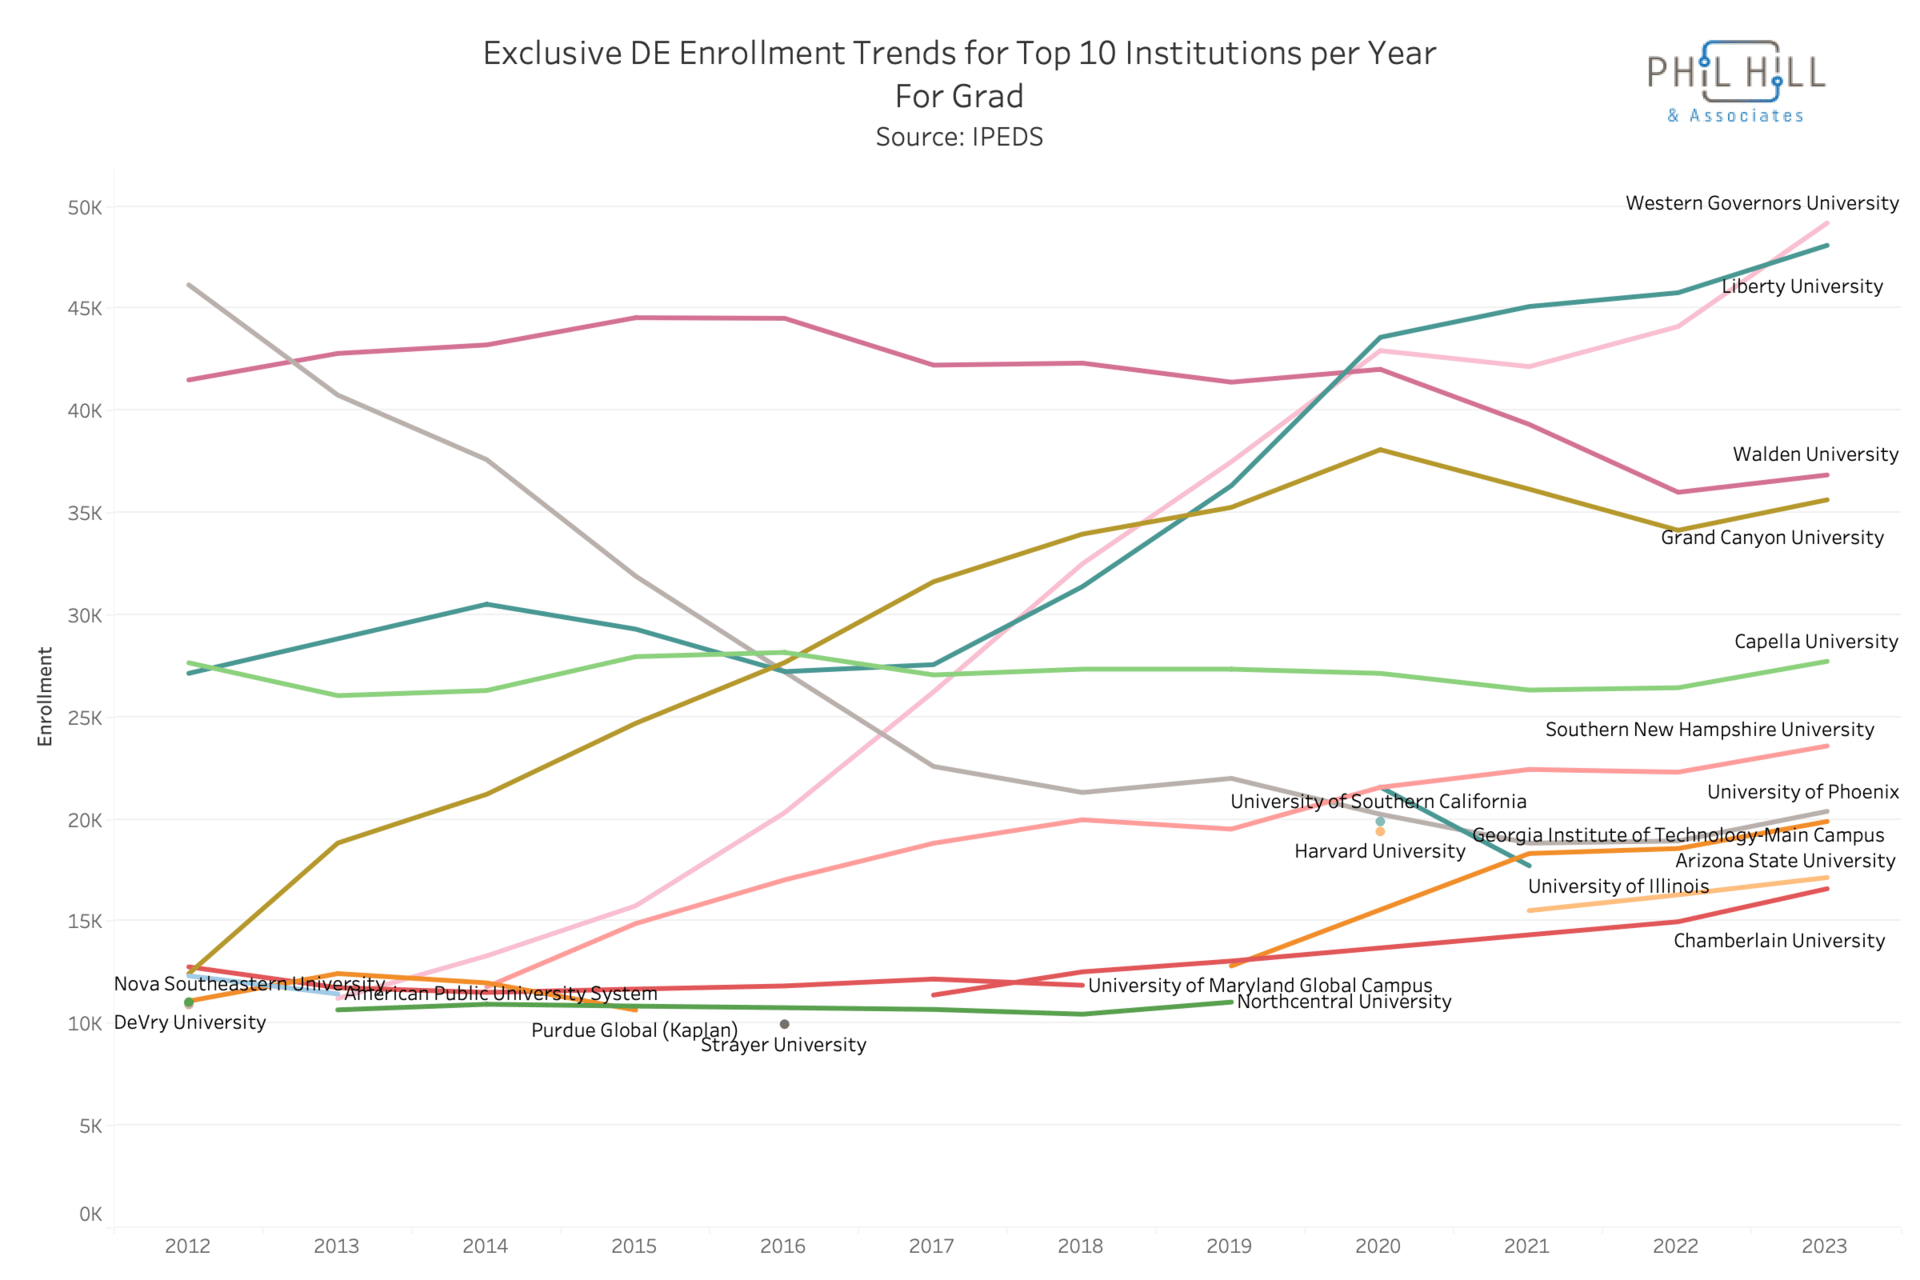
In the graduate market, the rapid growth of Western Governors University (since 2016), Liberty University (since 2014), and to a lesser extent Grand Canyon University (since 2012), has largely offset the decline in enrollment at the University of Phoenix. While the market giant University of Phoenix shrank significantly between 2012 and 2017 and many new players entered the space, the outsized growth of a few other large institutions kept overall market concentration from falling as much as one might expect.
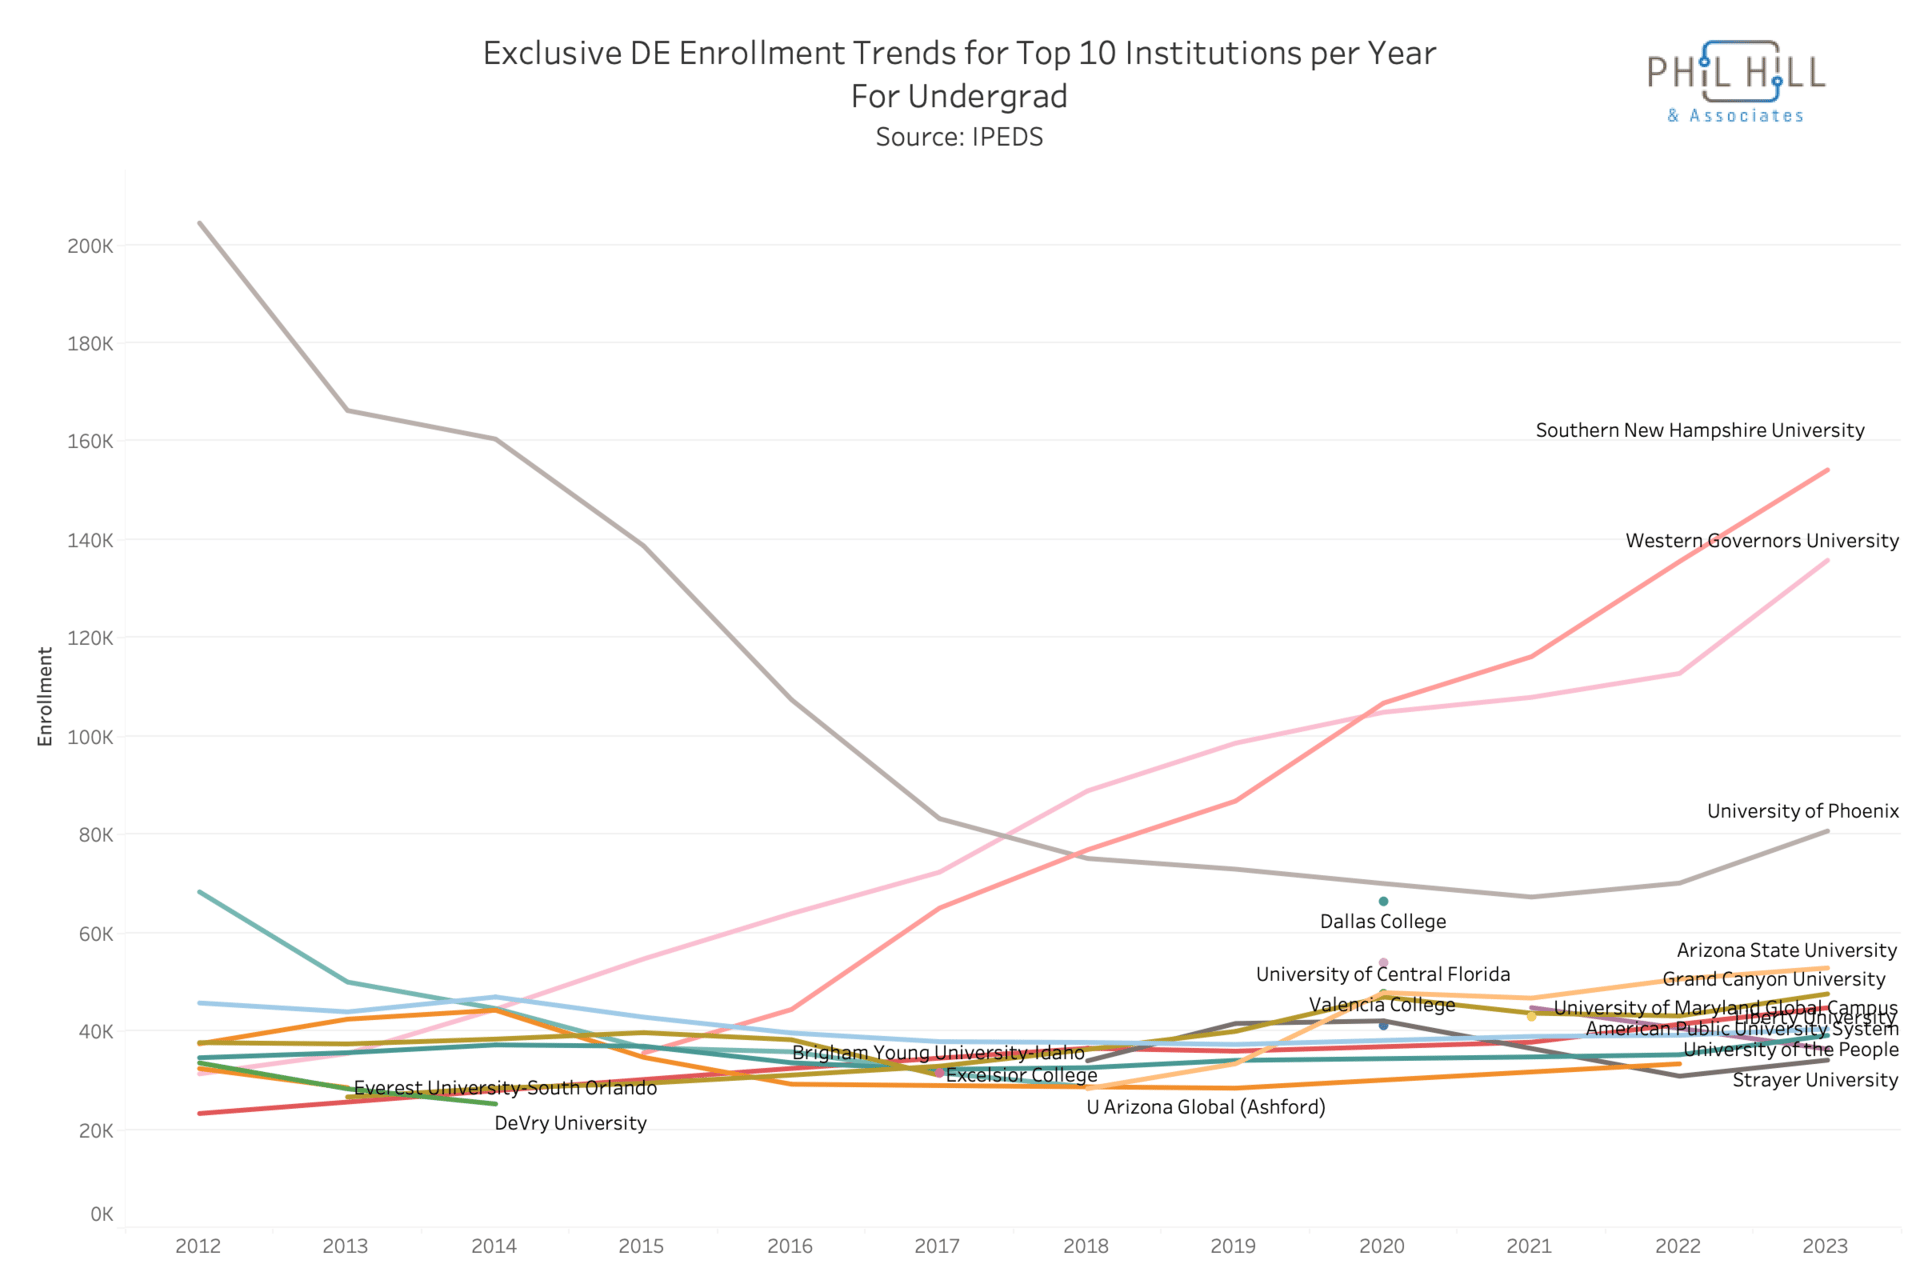
We see a similar dynamic in the undergraduate market. Growth at Southern New Hampshire University and Western Governors University has offset the decline in enrollment at the University of Phoenix.
Parting thoughts
Market concentration in online learning is an important issue and offers a fascinating lens through which to examine the dynamics of the sector. It not only influences student choice but also highlights the impact of scale, brand, and early-mover advantage.
As more colleges and universities turn to online programs for much-needed revenue, the ability of late-entering institutions to establish a presence and attract a meaningful number of students will become increasingly critical. Their success will, in large part, depend on how market concentration continues to evolve.
Below are the six data extracts from the charts in this post.

Subscribe to Premium to read the rest.
Become a paying subscriber of Premium to get access to this post and other subscriber-only content.
Already a paying subscriber? Sign In.
A subscription gets you:
- • New content 3-4 times per week
- • Shared Q&A discussions
- • Access to data downloads for charts in post